Brainstorming Graphic Organizers
Graphic organizers, or visual representations of knowledge, are frameworks that facilitate teams as they challenge assumptions, experiment with new relationships between accepted components of a problem space, and as they consider unconventional alternatives within a domain.
Brainstorming Graphic Organizers is Day 8 of 100 Days of UX, an exploratory effort to survey the 100 methods of design outlined in Martin and Hannington's Universal Methods of Design. For 100 consecutive days, I learn one new method a day and write about it.
Some examples of these graphic organizers are Brainstorming Webs, Tree Diagrams, and Flow Diagrams.
Brainstorming Webs are used when visualizations of the relationships between a central concept and related ideas, supporting facts, or its characteristics would be useful. They can be created center-outward, when the central concept is identified first, or outside-in when the components are identified prior to their unifying theme.

Tree diagrams are used when any of a hierarchy, a classification system, or relationships between ordinate and subordinate ideas needs communicating.

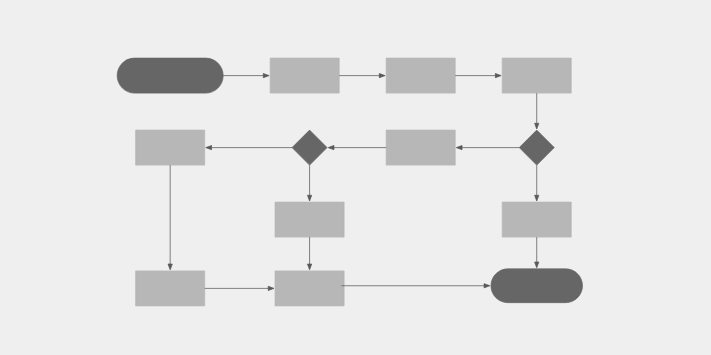
Flow Diagrams, or flowcharts, are used to represent sequences - of actions, processes, etc - and show cause and effect relationships.

References
- Martin, B., & Hanington, B. (2012). Universal Methods of Design: 100 ways to research complex problems, develop innovative ideas & Design effective solutions. Rockport
Day 7 - Bodystorming 100 Methods Day 9 - Business Origami